Comprehensive Analysis of an MNQ Trading Framework
Daily Trading Workflow
(96-tick / 192-tick Filter → 48-tick Execution)
Always follow these exact numbered steps before every trade. Higher TF bias is king.
Step 0 – Chart SetupOpen three charts side-by-side in NinjaTrader:
• 192-tick (macro view)
• 96-tick (default bias filter)
• 48-tick (execution chart)
For Long Trades Only
1. Check 96-tick: Is 50 EMA clearly above ribbon AND ribbon green/separating/sloping up? → YES = Bullish bias.
2. (Optional) Confirm with 192-tick if 96-tick is unclear.
3. On 48-tick: Confirm 50 EMA is also above ribbon (or has just crossed up).
4. Hunt A+ Setup #2 → Setup #1 → Setup #3 longs only.
5. Enter, stop below pullback low, manage to $250 / $150 rules.
For Short Trades Only
1. Check 96-tick: Is 50 EMA clearly below ribbon AND ribbon magenta/separating/sloping down? → YES = Bearish bias.
2. (Optional) Confirm with 192-tick.
3. On 48-tick: Confirm 50 EMA is also below ribbon (or has just crossed down).
4. Hunt A+ Setup #2 → Setup #1 → Setup #3 shorts only.
5. Enter, stop above pullback high, manage to $250 / $150 rules.
Chop / Neutral Bias (No Directional Trades)
1. 96-tick ribbon flat/converging or 50 EMA embedded → Chop mode ON.
2. On 48-tick only: Small-size magenta/red dot mean-reversion at 00-line extremes only.
• Long: magenta/red dot at lower extreme + higher low.
• Short: magenta/red dot at upper extreme + lower high.
Framework Overview
This detailed analysis presents a robust, rules-based trading framework for MNQ (Micro E-mini Nasdaq-100 futures) on 48-tick range charts. It integrates market structure via EMAs, Williams %R signals for confirmation, trend lifecycle phases for context-aware trading, signal grading for risk management, and specialized strategies for ranging markets using 00 lines and magenta/red dots. The system is designed to adapt across various market conditions, emphasizing discipline to avoid overtrading while capturing high-conviction opportunities.
Core Philosophy
Structure First, Signal Second: Always prioritize the EMA ribbon and 50 EMA to define the market's trend structure and lifecycle phase before evaluating any Williams %R signals. Highest conviction comes from Setup #2 — the first pullback after a decisive 50 EMA cross of the ribbon — as it captures fresh trend birth with minimal guesswork. In favorable contexts (birth or healthy phases), take directional trades; in exhaustion or ranging, shift to mean-reversion around 00 lines using magenta/red dots. Understanding trend maturation allows accurate grading and risk control.
The Three Setups
Setup #1: Trend-Following Pullback Confirmation
Designed for the healthy phase of a trend lifecycle, where the market accelerates in a clear direction. Enter long (uptrends) or short (downtrends) after a shallow or moderate pullback to the 50 EMA (dynamic support/resistance). Confirmed by a Williams %R dot (yellow for fast timing, stacked for higher grades). Ribbon must be separated and sloped in trend direction, no convergence. Ideal post-birth acceleration with brief pullbacks leading to continuation. Example: In uptrend, price dips to lime 50 EMA above green ribbon, blue dot confirms bounce.
Setup #2: Trend-Reversal Confirmation (Highest Priority / A+ Tier)
Targets the birth phase of a new trend, capturing shifts from exhaustion or ranging. Enter on the first pullback to the 50 EMA after it crosses the ribbon (e.g., 50 EMA moves above for bullish reversal). Confirmation via WR dot at pullback low/high. Ribbon color flips with initial separation signaling strength. Often follows failed mature setups or ranging breaks. Highest conviction with stacking, but watch for fakeouts in chop. Mechanical stop placement under/above the pullback extreme. Example: After bearish exhaustion, 50 EMA crosses up, price pulls back with skyblue dot for long entry. This is the "no-guess" rocket-launch setup — prioritize for full size.
Setup #3: Deep Pullback to Ribbon Confirmation
Aimed at the mature phase, handles volatile corrections in established trends. Enter after price overshoots 50 EMA and tests ribbon as deeper support/resistance, confirmed by WR dot (stronger with stacking). Ribbon remains colored and separated in trend direction. First deep pullback after Setup #2 often carries high conviction; subsequent ones risk failure into exhaustion. Example: In uptrend, deep dip to green ribbon with multi-dot stack for long bounce, but later dips may fail near 00 lines.
Chop Zone Filter
Avoid all directional trades when the 50 EMA is embedded within a flat or converging ribbon (exhaustion or ranging phases). Prevents losses in indecisive markets. Shift to mean-reversion around psychological 00 lines using only magenta/red WR dots for reversals at extremes. Re-enter directional trading only after ribbon separates and 50 EMA breaks out decisively. Example: In flat ribbon, skip setups and fade extremes with red dot shorts.
Signal Grading for Risk Management
A+ (Highest Confidence)
Reserved primarily for confirmed Setup #2 entries — first pullback after decisive 50 EMA ribbon cross in birth phase — where structure provides the cleanest edge with minimal guesswork. Tight stacking of 3+ WR dots enhances timing, but the fresh cross + pullback is the dominant factor. Requires steeply sloped ribbon with wide initial separation. Full position size justified for high win-rate and large moves. Rare; prioritize aggressively when present. Example: First pullback dot(s) after bullish 50 EMA cross in early trend birth.
B (Standard)
Reliable signals in healthy or early mature phases: Single or loosely paired WR dots in clear trend with moderate ribbon separation/slope. Common in Setup #1 continuations and later Setup #3 pullbacks. Standard position size; good R:R. Example: Yellow dot on shallow 50 EMA pullback in sloped ribbon.
C (Lower Confidence)
Marginal signals in late mature or near-exhaustion: Valid WR dot but weakening context (flattening EMAs, narrowing ribbon, post-failure pullbacks). Reduced size to limit drawdowns; higher failure risk into chop. Example: Isolated blue dot in decelerating trend near 00 lines.
Trend Lifecycle Phases
Understanding trend maturation adds predictive power: Trends evolve from inception to decline, influencing setup reliability and grading.
- Birth Phase: Trend starts with reversal (Setup #2 first pullback after cross); ribbon flips color, initial steep separation. Highest A+ potential here.
- Healthy Phase: Acceleration with clean pullbacks (Setup #1/#3); ribbon widely fanned, steep slope. Frequent B grades for continuations (A+ possible on strong stacks).
- Mature Phase: Deceleration with deeper volatility (later Setup #3); ribbon narrows, slope flattens. Mostly B/C; repeated pullbacks often fail.
- Exhaustion Phase: Trend dies; ribbon converges, Chop Filter active. Shifts to ranging around 00 lines with magenta/red reversals.
00 Lines and Magenta/Red Dot Ranging Trading Rules
In exhaustion or chop phases, trade mean-reversion around psychological 00 lines using only magenta (112-period) or red (224-period) WR dots for reversals at extremes. Rules:
- Identify ranging: Flat/converging ribbon, price coiling ±100-200 ticks around 00 line.
- Longs: Magenta/red oversold dot at lower extreme (wick below line + bounce).
- Shorts: Magenta/red overbought dot at upper extreme (rejection above line).
- Filters: Proximity to 00 line (±50 ticks); no trade in mid-range or without prior swing.
- Sizing: Small (C-grade equivalent); tight stops (20-50 ticks beyond extreme).
- Targets: Opposite range side or mid-point (1:1-2:1 R:R).
- Exit: Counter magenta/red dot or time-based in session close.
This exploits round-number psychology in low-momentum markets, typically 2-4 trades per session. Always lower priority than a fresh Setup #2.
Multi-Role EMA Ribbon
The ribbon (180/190/200/210 EMAs) is central: Defines phases (fanning in healthy, converging in exhaustion), provides S/R in pullbacks, signals profits at opposition, and flips for reversals (key Setup #2 trigger). In ranging, flattens near 00 lines, cueing magenta/red tactics.
Detailed Chart Analyses
The framework was developed through 11 charts, each highlighting aspects of setups, grading, lifecycles, and ranging rules with insights from real MNQ sessions.
Chart 1: Core Pullback Strategy
Healthy uptrend phase with shallow pullbacks to 50 EMA, confirmed by single/paired WR dots (B-grade Setup #1). Ribbon shows strong separation/slope, no chop. Later maturation leads to deeper dips hinting at Setup #3.
Key Finding:
Setup #1 thrives in healthy phases with B grades; absent stacking keeps it from A+. Maturation failures transition to ranging around 00 lines with magenta dots.
Quick Recap for Easy Copy-Paste
Quick recap of our Project25 / MNQ trading discussion so far:
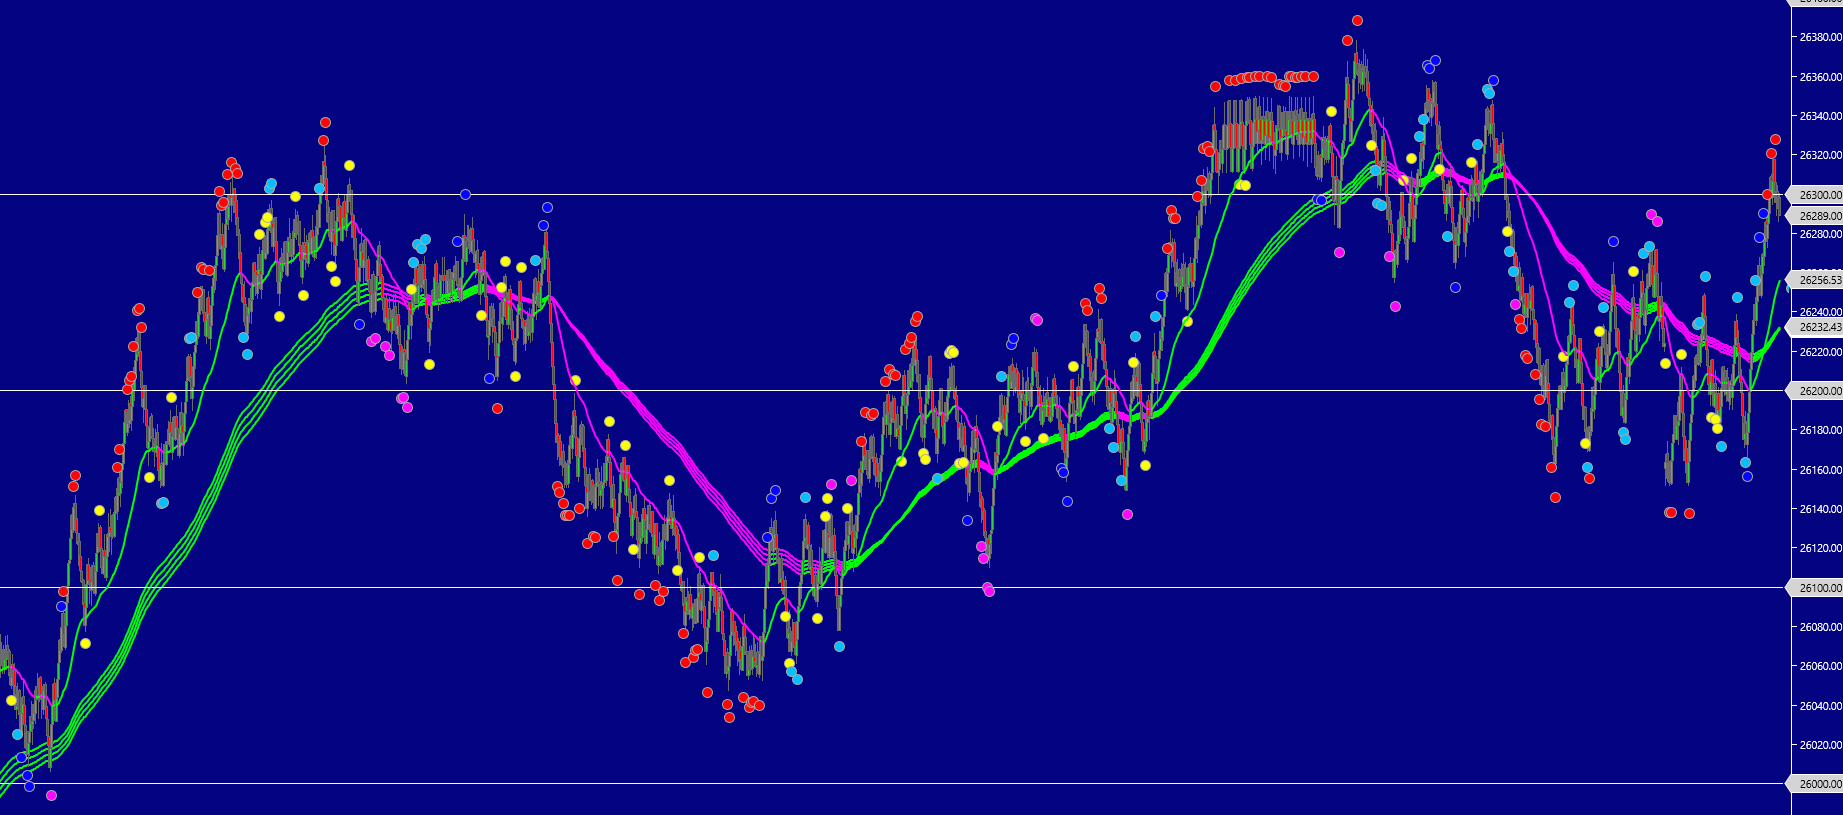
Chart setup (48-tick range bars):
Indicators:
• Williams %R dots: yellow=14 (fast), skyblue=28, blue=56, magenta=112, red=224 (slowest/strongest)
• 50-period EMA (thicker single line, often lime/green bullish or magenta/pink bearish)
• EMA ribbon: 180/190/200/210 periods (bundled lines, color shifts lime/green bullish, magenta/pink bearish; separation = trend strength)
• Key levels: "00 lines" (round numbers ending in 00) act as strong psychological S/R in ranges
Framework Overview:
Robust, rules-based system for MNQ on 48-tick range charts. Combines EMA-based market structure, Williams %R confirmation signals, trend lifecycle awareness, signal grading for risk control, and mean-reversion tactics in chop using 00 lines + magenta/red dots. Emphasizes discipline and high-conviction opportunities only.
Core Philosophy:
Structure First, Signal Second: Always read the EMA ribbon + 50 EMA to determine trend structure and lifecycle phase before acting on any WR signals. Highest edge comes from Setup #2 — the first pullback after a decisive 50 EMA cross of the ribbon (fresh trend birth with mechanical stop placement and minimal guesswork). Trade directionally in birth/healthy phases; switch to 00-line mean-reversion in exhaustion/ranging. Lifecycle awareness drives accurate grading and sizing.
The Three Setups (priority order):
1. Setup #2: Trend-Reversal Confirmation (Highest Priority / A+ Tier)
Targets birth phase — new trend ignition after exhaustion or ranging. Enter on the **first pullback** to the 50 EMA after it crosses the ribbon (e.g., 50 EMA above ribbon = bullish reversal). Confirm with WR dot(s) at pullback low/high. Ribbon flips color with initial separation = strength. Mechanical stop: under pullback low (long) or above high (short). Highest conviction (full size) when fresh cross + dot confirmation; stacking enhances but structure is king. Often follows failed mature setups or ranging. Example: Bear exhaustion → 50 EMA crosses up → pullback with skyblue/yellow dot → long entry.
2. Setup #1: Trend-Following Pullback Confirmation
Healthy phase acceleration in clear trend. Enter after shallow/moderate pullback to 50 EMA (dynamic S/R). Confirm with WR dot (yellow fast, stacked stronger). Ribbon separated + sloped in trend direction (no convergence). Brief pullbacks → continuation. Example: Uptrend dip to lime 50 EMA above green ribbon + blue dot bounce.
3. Setup #3: Deep Pullback to Ribbon Confirmation
Mature phase volatile corrections. Enter after overshoot of 50 EMA to test ribbon as deeper S/R. Confirm with WR dot (stronger with stacking). Ribbon still colored/separated in trend direction. First deep pullback after Setup #2 often high-conviction; later ones risk failure. Example: Uptrend deep dip to green ribbon + multi-dot stack → long.
Chop Zone Filter:
No directional trades when 50 EMA is embedded in flat/converging ribbon (exhaustion/ranging). Prevents chop losses. Switch to small-size mean-reversion at 00-line extremes using **only magenta/red WR dots**. Re-enter directional only after ribbon separates + 50 EMA breakout.
Signal Grading for Risk Management:
• A+ (Highest Confidence): Primarily reserved for confirmed Setup #2 (first pullback after decisive 50 EMA ribbon cross) in birth phase — cleanest edge, full size justified. Tight 3+ WR dot stacking upgrades timing but is secondary to the fresh cross structure. Steep ribbon slope + wide initial separation required. Rare, explosive potential.
• B (Standard): Reliable in healthy/early mature: single/loosely paired WR dots in clear trend with moderate ribbon separation/slope. Standard size, good R:R. Common in Setup #1 and solid Setup #3.
• C (Lower Confidence): Marginal in late mature/near-exhaustion: valid dot but weakening context (flattening/narrowing ribbon, post-failure). Small size only.
Trend Lifecycle Phases:
• Birth: Setup #2 reversal + ribbon flip/initial separation → highest A+ potential.
• Healthy: Acceleration, clean pullbacks (Setup #1/#3) → frequent B (A+ possible with strong stacks).
• Mature: Deceleration, deeper volatility (later Setup #3) → mostly B/C, repeated pullbacks often fail.
• Exhaustion: Ribbon converges → Chop Filter on → shift to 00-line magenta/red reversals.
00 Lines and Magenta/Red Dot Ranging Rules (Lowest directional priority):
In chop/exhaustion, mean-reversion at psychological 00 lines using **only magenta/red dots** at extremes.
• Identify: Flat/converging ribbon + price coiling ±100-200 ticks around 00 line.
• Longs: Oversold magenta/red dot at lower extreme + bounce.
• Shorts: Overbought magenta/red dot at upper extreme + rejection.
• Filters: ±50 ticks proximity; no mid-range trades; prior swing required.
• Sizing: Small (C-grade level); tight stops (20-50 ticks beyond extreme).
• Targets: Opposite side or mid-range (1:1–2:1 R:R).
• Exit: Counter dot or session time-based.
Exploits round-number psychology in low-momentum; 2–4 trades/session typical. Never allocate big size here when Setup #2 is possible.
Multi-Role EMA Ribbon:
Central tool — defines lifecycle (fanning = healthy, converging = exhaustion), provides dynamic S/R, signals reversal on cross (Setup #2 trigger), opposes for profit-taking. Flattens near 00 lines in ranging → cues magenta/red fades.
Now analyzing this new chart:
[then paste/upload the chart image here]
Recommended Sequence for Fresh Chart:
Paste the recap block above (or shortened version).
Immediately follow with chart image.
(Optional) Add 1–2 feeling/question lines, e.g.:
"Feels like possible Setup #2 forming—what's your read?"
"Any A+ birth candidates?"
"Choppy—focus on magenta/red at 00s?"
"Setup #1 continuation or #2 reversal?"